The best process maps look simple and are easy to use. But, to quote Steve Jobs, ‘simple can be harder than complex’. The simpler a process map looks, the more effort may have gone into breaking down complex information and presenting it in a clear and effective visual way.
Our top five rules, distilled from decades of consulting and teaching, will help you cut through complexity and develop simple and effective process maps.
1. Define the process
Before you start diagramming, pause for a moment and give some thought to these questions:
- What is the purpose of the process? What output or result does it produce?
- What are the start and end points? What triggers the process, and what is a logical end point?
- Where does it fit in the bigger scheme of things? What bigger process is it a part of? Are there related processes? Is the process output an input into another process?
By thinking about context and purpose, you can hone in more precisely on what’s important about the process you’re mapping.
Tip: Be as precise and descriptive as possible when naming the process. For example, ‘On-boarding a new user’ is more informative than ‘New user process’ (which could mean something quite different).
2. Describe ‘normal’
Focus on the main events and on what normally happens. A good guideline is to capture what happens about 80% of the time.
Of course most processes have exceptions or variations, but including them all may obscure the normal process flow. If variations are major or happen frequently, think about splitting them off into a separate process or sub-process.
For example, a software release process could be presented as two separate processes, depending on whether the release is a background release (no user impact) or a release with user-impacting functionality changes.
Tip: For minor variations, use a simple If-statement such as ‘If the claim is over $50,000, requests manager’s approval.’
3. Use active verbs
In cross-functional swimlane diagrams, you’re describing what each function (or role) does. So always use active verbs in the task boxes.
Example:

Tip: Avoid passive verbs or noun phrases without a verb. ‘Proposal presented’ or ‘First draft of annual plan’ don’t show who does these things. Proofread your diagrams and ensure you’ve used active verbs throughout.
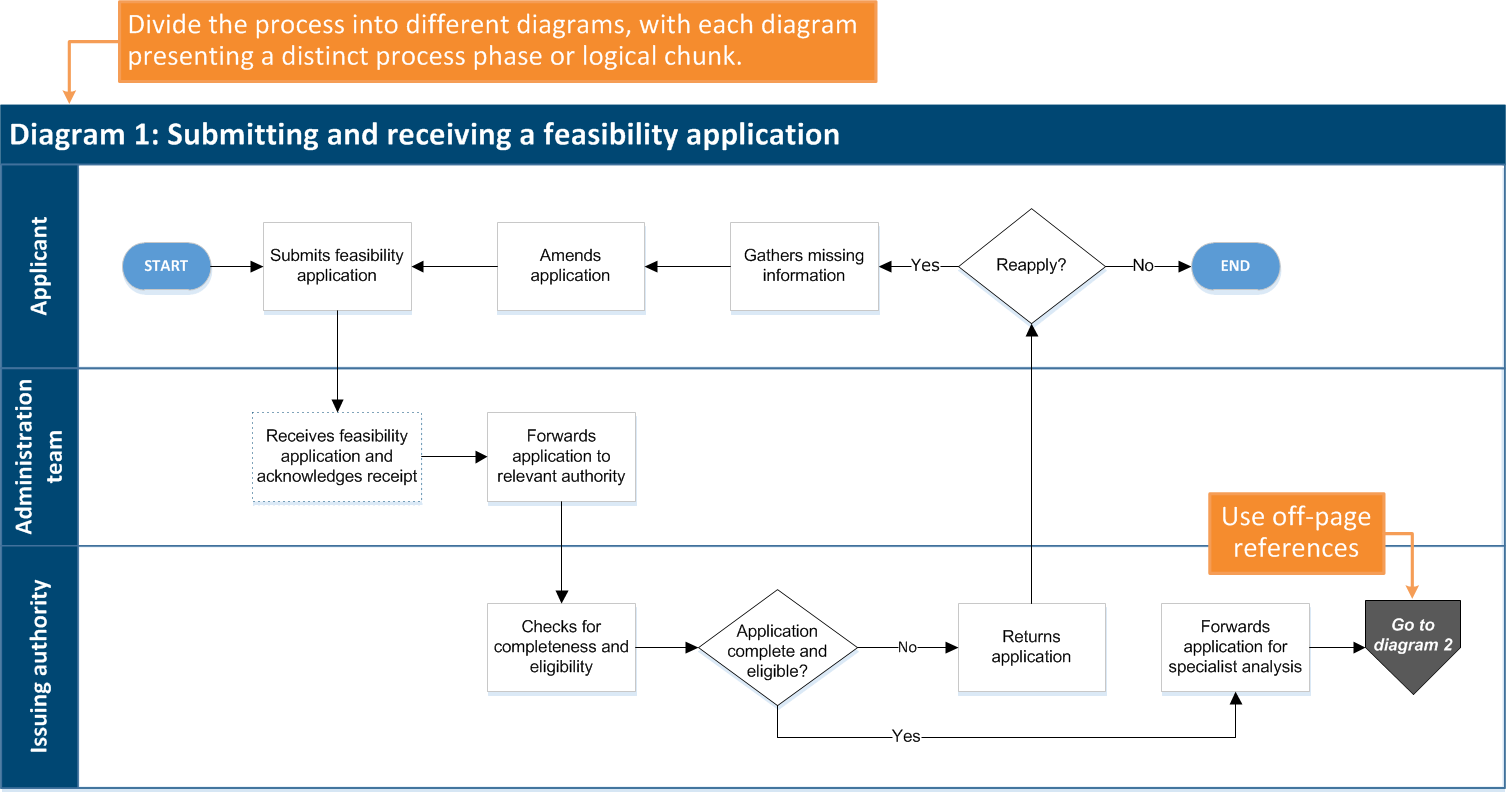
4. Chunk and divide
Cognitive science tells us that our brains can’t process more than seven plus/minus two pieces of information at once (Miller’s Law). We’re also more likely to understand and remember information if it’s presented to us in logical categories or chunks.
Example:
The parent process below is ‘Processing a feasibility application’. It can be divided into three logical chunks:
- Submitting and receiving a feasibility application
- Conducting a specialist analysis
- Approving or declining the application and notifying the applicant

Tip: A good rule of thumb is to chunk or divide a process map that doesn’t comfortably fit on a landscape A4 page, or if it has more than five functions (swimlanes) or 10 tasks.
5. Connect everything
Watch out for ‘dangling’ boxes that sit somewhere by themselves without connecting to anything. Process maps show relationships between tasks, and tasks don’t usually happen in isolation. If the task is not needed as an input into another task, why is it there?
Unconnected tasks can alert you to missing information, a break or gap in the logical process flow, or a duplicated or unnecessary task.
Example:

Tip: Double-check task connections before finalising a diagram. Watch out for dangling boxes and revise the diagram so they connect to another task, a sub-process or off-page reference, or an End point. Also ensure that decision diamonds have both a Yes and a No path. The No path is easily overlooked if it is an exception and not the normal process.
Help and feedback
If you’ve completed a Tactics Process Mapping workshop, remember that you can send us your mapping questions or ask us for feedback on your diagrams. We’d love to hear from you.
Call us on 0800 50 50 56 or email us.


Comments are closed.